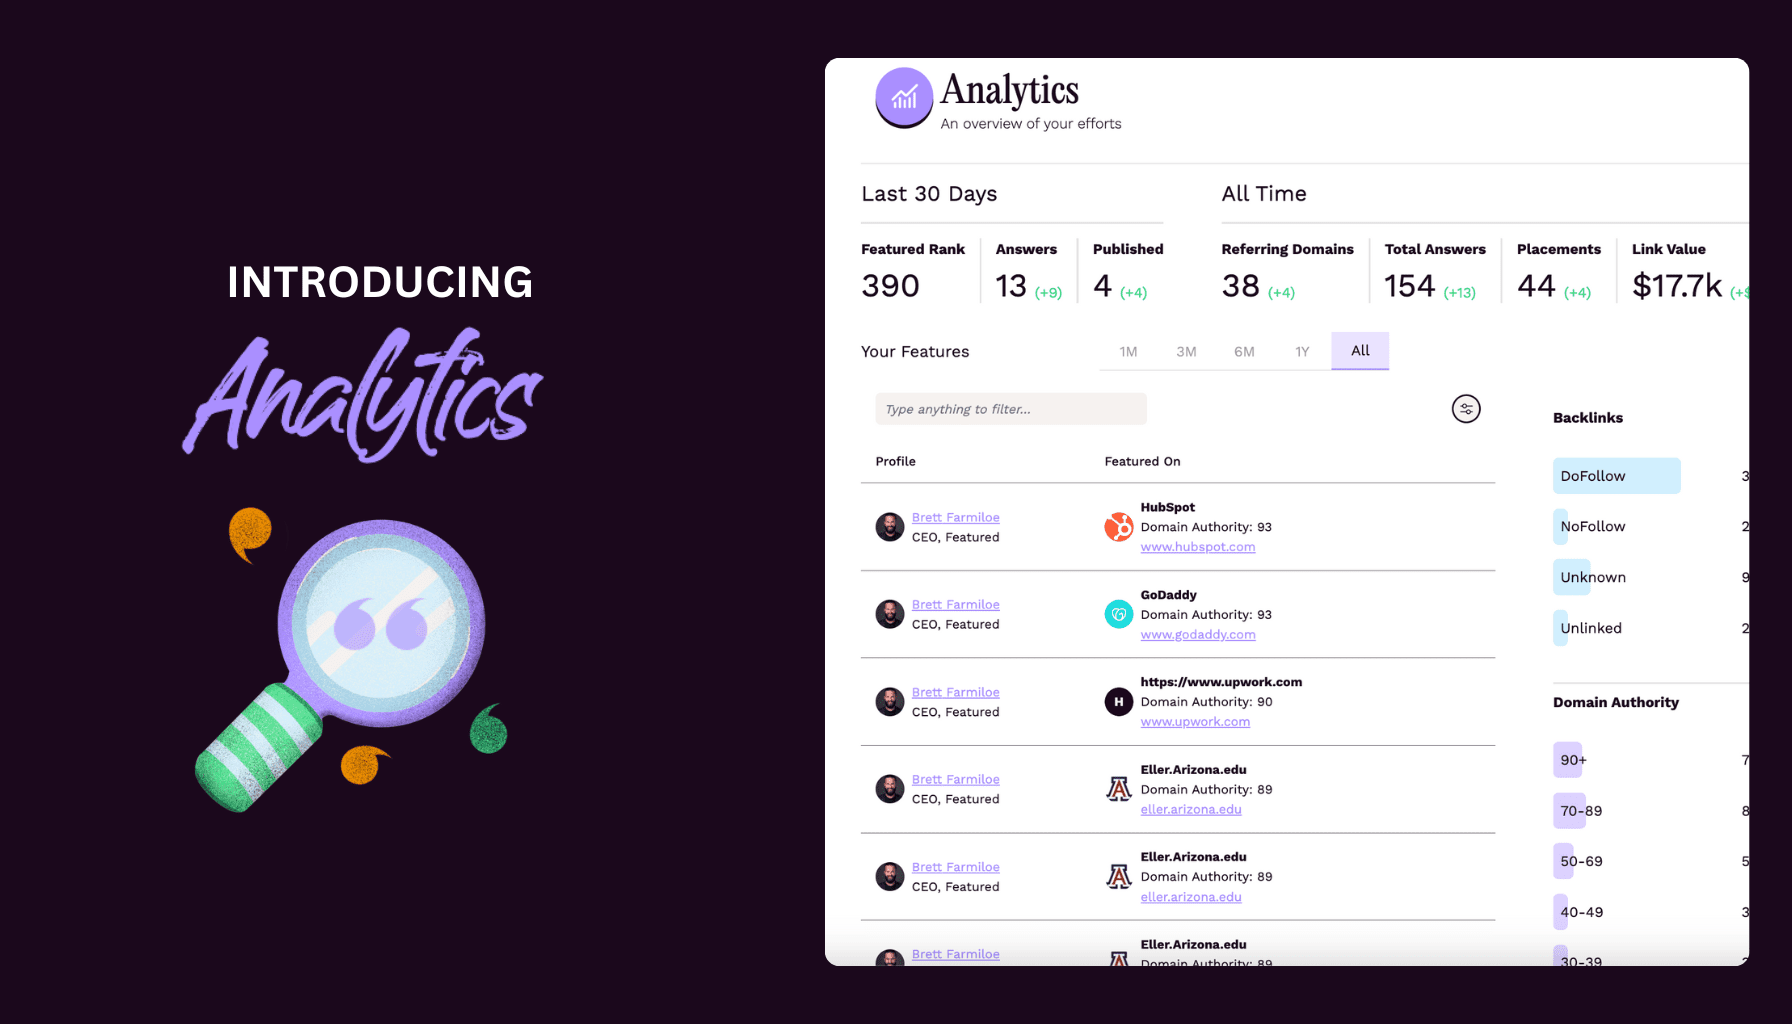
We believe that what gets measured gets improved — which is why we’ve built Featured Analytics to help you track, measure, and optimize your efforts on Featured.com.
Whether you’re an individual expert, agency, or business, Featured Analytics provides a comprehensive overview of your activity and results, helping you make data-driven decisions, demonstrate ROI, and stay on top of your Featured strategy.
What is Featured Analytics?
Featured Analytics is your go-to dashboard for tracking performance metrics on Featured. It offers both short-term insights with the Last 30 Days section and long-term progress through All Time metrics—all designed to help you understand how your activity translates into media placements and brand visibility.
Key Metrics in Featured Analytics
Last 30 Days Metrics
The Last 30 Days section compares your recent activity with the previous 30 days, providing immediate insight into your momentum. Metrics include:
- Featured Rank: Ranks all accounts on Featured based on the quantity and quality of media placements—essentially measuring the strength of your digital presence.
- Answers: The number of answers you’ve submitted to questions from journalists and publications.
- Published: The number of your answers that have been featured in published articles.
All Time Metrics
For long-term tracking, All Time metrics offer a cumulative view of your achievements:
- Referring Domains: The total number of unique publications you’ve been featured on.
- Total Answers: The cumulative number of answers you’ve submitted.
- Placements: The total number of answers published in articles.
- Link Value: Quantifies the monetary value of your earned media placements using industry-standard benchmarks—showing how much you’ve saved compared to paid placement methods.
Explore More Sections in Featured Analytics
Beyond the core metrics, the Analytics dashboard includes several sections that provide deeper insights:
Your Features
Track all your top features across various publications. This section displays:
- Profile featured (Column A)
- Publication details (Column B) including the publication name, domain authority (DA), and a direct URL.
You can:
- Filter features by timeframes: Last month, 3 months, 6 months, 1 year, or all-time.
- Use the search bar to quickly find features tied to a specific profile.
Backlinks
Understand the backlink profile generated through your Featured activity. The Backlinks section shows:
- Link types: DoFollow, NoFollow, Unlinked, and Unknown.
- Visual breakdowns: Graphs display the quantity and percentage of each backlink type.
📊 Example: Out of 44 backlinks, if 31 are DoFollow, the dashboard shows that 70% of your backlinks are DoFollow—indicating strong SEO value from Featured placements.
Domain Authority
See how authoritative your placements are with a visual breakdown of domain authority ranges, including:
- 90+ DA
- 70-89 DA
- 50-69 DA
- 40-49 DA
- 30-39 DA
- 20-29 DA
- 10-19 DA
- >10 DA
This section displays both quantities and percentages, making it easy to assess the overall strength of your media exposure.
Referring Domains
Get a snapshot of the top-level domains (TLDs) of your placements. Categories include:
- .com
- .edu
- .net
- .co
- .io
- .org
- and more
Understanding TLD diversity helps gauge the variety and authority of your media presence.
Why Featured Analytics Matters
- Quantify Your Efforts: Measure the impact of your work with clear, easy-to-read metrics.
- Justify ROI: Show clients or stakeholders the tangible value of your placements and activity.
- Inform Strategy: Identify what’s working, where you can improve, and how to prioritize future efforts.
- Gamify Your Progress: Stay motivated with monthly performance comparisons and milestone notifications.
How to Access Featured Analytics
To view your analytics:
- Log in to your Featured account.
- Navigate to Analytics under the Admin tab in the left-hand sidebar.
- Monthly Performance Reports for Pro & Business Plans
Users on a Featured Pro or Featured Business plan receive monthly performance reports delivered straight to their inbox. These reports include:
- Featured Rank
- Answers Submitted & Published (last 30 days and all-time)
- Link Value
- Month-over-month comparisons
- Your Features from the past 30 days
- Gamification updates (e.g., milestones achieved)
These summaries make it even easier to stay informed and demonstrate value to clients and stakeholders.
Ready to Get Started?
Featured Analytics is your personal dashboard for media success—helping you track, improve, and showcase the impact of your efforts on Featured.
👉 Log in to your Featured account to explore your analytics today.
Not a Featured user? Sign up now to gain access to powerful insights and tools that elevate your media presence.
